
Shapefiles must be zipped before uploading. Click here for more information.
Layer Filter & Settings
Populating grid...
Zoom to Street Address
Zoom to Latitude/Longitude
Select Additional Layers
| Marcellus Wells |

|
|
| Marcellus Wells (Hotspot) |

|
WV County Boundary |

|
| HUC-8 Watersheds |

|
|
| Coal Mining Boundary | ||
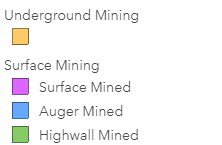
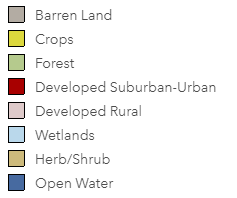
| NLCD Land Cover | ||
Click on a water quality sample location point to view information & chart
(Scatter chart showing data values will be displayed here)
Back to Map
The objective of the WVWQIP is to provide stakeholders with information about past and current water quality in the 14 counties where the majority of Marcellus Shale gas development in West Virginia has occurred. This collection of data can help inform decisions made by regulators and policymakers, while providing transparency and public outreach opportunities.
Within the WVWQIP, you will find:
• Water quality data for over 1.3 million surface and ground water samples from 4,953 unique sampling locations aggregated from local, state, and federal organizations
• Map viewer that allows for quick visualization of monthly mean water quality trends
• Graphs to visualize temporal water quality trends
• Story Maps that explain potential water quality impacts associated with energy development and results of research projects
• Links to partner organizations that provided data and financial support to the portal
• Links to download the full water quality data set and upload data
The WV Water Quality Impact Portal was developed by the WV GIS Technical Center and the IsoBioGem Laboratory at West Virginia University. Financial support was provided by the U.S. Environmental Protection Agency through Exchange Grant #83940901.
For citation: Sharma, S., Sharma, M., Han, Y., Yesenchak, R, Donaldson, K. 2020. The West Virginia Water Quality Impact Portal. WV Water Quality Impact Portal
Contact Us:
Primary Contact
Dr. Shikha Sharma
Professor of Geology
Director, IsoBioGem Lab
Department of Geology & Geography
shikha.sharma@mail.wvu.edu
304-293-6717
Technical & Data Contacts
Primary Contact
Dr. Shikha Sharma
Professor of Geology
Director, IsoBioGem Lab
Department of Geology & Geography
shikha.sharma@mail.wvu.edu
304-293-6717
Technical & Data Contacts
| Maneesh Sharma | Yibing Han | Rachel Yesenchak |
| maneesh.sharma@mail.wvu.edu | yibing.han@mail.wvu.edu | rey0002@mix.wvu.edu |
| 304-293-6694 | 304-293-0557 | 304-293-8253 |
Back to Map
Our goal is to provide water quality-related information in an understandable and engaging format. Below you will find Story Maps that explain water quality impacts related to energy development and relevant research project results.
Energy Development and the Effects on West Virginia’s Water: This story map presents a brief overview of energy development in the state and reflects on related water quality impacts
Surface Water Quality Effects of Shale Gas Development: A Case Study from West Virginia: This story map provides background information and results of a small-scale analysis on potential surface water quality effects related to shale gas drilling in the northern panhandle of West Virginia
Back to Map
Financial support was provided by the United States Environmental Protection Agency through Exchange Grant #83940901
Water quality data was provided by:
West Virginia Department of Environmental Protection
Friends of Deckers Creek

Water quality data was provided by:
West Virginia Department of Environmental Protection
Friends of Deckers Creek