![]()
West Virginia State Historic Preservation Office (SHPO)
Interactive Map Viewer
Updated 12/12/2023
Click here to access the public map
Click here to access the user management portal and log in to access the secured portal
Contents
Part 1: Overview of the Map Viewer
Part 3: Identify Tool & Information Panel
4. 2 Search / Zoom to location
4.2.2 Search Features by Attributes
4.2.3 Search Features by ID or Name
4.2.4 Search Feature by Geometry
4.2.6 Search / Zoom to Geographic Name
4.2.7 Zoom to City / County / USGS Quad.
Part 1: Overview of the Map Viewer
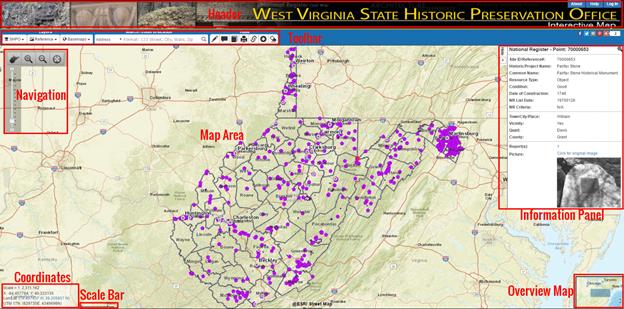
The figure above shows the layout of SHPO Map Viewer. There are a total of eight components:
1. Header
2. Map Area
3. Tool Bar
4. Side Information Panel
5. Navigation Tools
6. Coordinates Display
7. Overview Map
8. Scale Bar
The Map Area displays all the map layers as well as graphics made by user selection, search and other map tools. It interacts with almost all other components listed. This help document will mainly focus on the following major components: Header, Tool Bar, Side Information Panel and Navigation Tools.
Part 2: Header
Right below the header section, there are three menu buttons – About, Help, and Login / Logout.

2.1 About
By clicking the “About” button, a pop-up window will show up, displaying the overview information of the SHPO Map Viewer application as well as the disclaimer.
2.2 Help
By clicking the “Help” button, two pop-up windows will show up, displaying the application title, related links and a quick start guide respectively. These two windows are also shown up when the application was first loaded. The two windows can be closed by clicking the “OK, I Get It” button. The user can also check the “Don’t show me again” to prevent these two windows to show up in the future when loading the map.
2.3 Login / Logout
By clicking the button, the user will be redirected to the SHPO user management portal for log into/ log out of the system. The button reads “Log In” if the user is not logged into the SHPO system. Once logged in, the button changes to “Log Out”.
Part 3: Identify Tool & Information Panel
3.1 Identify tool
The identify tool is automatically activated when the map is loaded. By clicking on the map area, the identify tool will query if there’s a feature available within the tolerance distance of the mouse click point. If there is more than one feature found, the nearest feature will be highlighted, and its attributes information will be displayed in the side information panel.
Please note that when certain map tools (Measure and Text Markup) are activated, the identify tool will be temporarily deactivated, and will be re-activated when the window of those tools are closed.
3.2 Information panel
The information panel is hidden
when the map first loads. It will show up with mouse click on the map. It can
be manually expanded/collapsed by click on the Show (![]() )/ Hide (
)/ Hide (![]() ) button on the left of the
panel.
) button on the left of the
panel.
If no feature is found by the identify tool, the side panel will notify the user that no feature is selected; if there is a feature returned, the side panel will display its detailed attributes information (see figures below). In addition, it will also display Parcel ID based on the map point clicked.
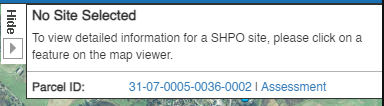
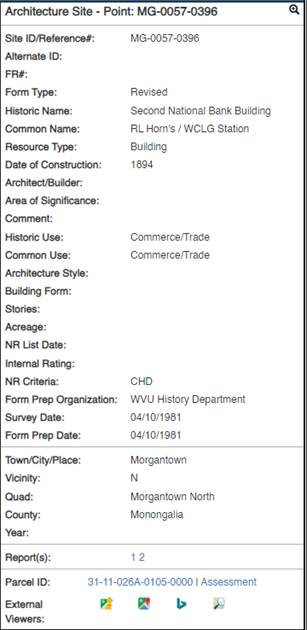
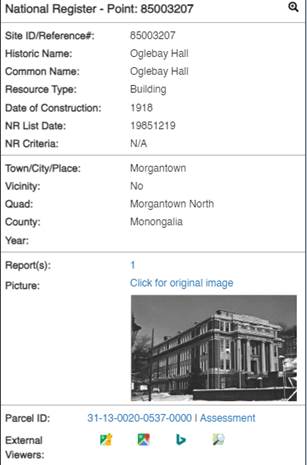
The information panel will have different sets of information shown based on the type of feature selected. However, for every type of feature, the information panel always includes the following 5 sections:
1. Title: Layer Name and feature’s ID number;
2. Zoom in button: every click will zoom into the selected feature one scale level higher, until the finest scale is reached;
3. Primary attribute information: ID, Reference Number and/or Name(s);
4. Site-specific attribute information: different sets of attributes for different types of feature;
5. Location information: County, Quad(s), City/Town/Area, and Vicinity.
6. Reports / Picture: if the feature has any reports, the link to corresponding report is listed in that section. For most National Register features, a small picture of the site will also be displayed in this section, with a link to the original full-size image.
7. Parcel ID: identified Parcel ID based on map point user clicks. The ID also serves as a link to the WV Parcel Viewer web app, as well as a link to the detailed parcel assessment report page.
8. External Viewers: provides links to Google Street View (if available), Google Maps, Bing Maps and OpenStreetMap for the map point clicked.
Fields with empty value or “Null” suggest that there are currently no corresponding data in the database. These attributes might become available during future updates.
Part 4: Tool Bar
4.1 Layers
The first section of the Tool Bar is for layers to be displayed in the map area. (see the figure below).
![]()
The Layers section includes three drop-down buttons for three subcategories: SHPO layers, Reference layers and Background layers.
4.1.1 SHPO Layers
By Clicking the SHPO button, a panel will show up with the list of SHPO layers that are available to view based on your login permissions (see the figure below).
On the top of the SHPO layers panel, there is a scroll bar that allows the user to set the opacity of all the SHPO layers. The opacity value ranges from 0% (left) to 100% (right). “0%” means SHPO Layers are complete transparent, “100%” means SHPO layers are completely opaque. Please note the opacity CANNOT be set to an individual layer.
Below the opacity bar, there is a list of available SHPO layers. Each list item includes the following elements:
· Checkbox to turn on/off a layer and all layers
· Legend of a layer (including demolished for architecture and NR)
· Layer name
· Checkbox for toggling labels of the layer
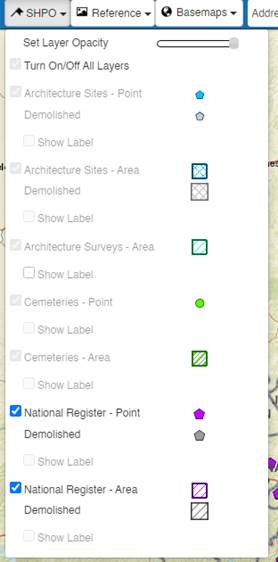
By default, all the layers are set as visible when the map first loads. Any layer can be turned on (visible) / off (invisible) by checking / unchecking its corresponding checkbox. Some scale-dependent layers will not show up if the zoom level isn’t high enough, in such case, the checkboxes of these layers will be disabled until the map scale is within the visible scale range set for these layers.
By default, the labels for all layers are disabled. The checkboxes for labels will only be activated after the map is zoomed in to a scale larger than 1: 36,112 AND its source layer is checked to be visible. If the source layer is unchecked, its corresponding label will also be unchecked automatically; If the user zooms out the map to a scale smaller than 1: 36,112, the labels will also be disabled.
4.1.2 Reference Layers
By Clicking the Reference button, a panel will show up with the list of reference layers that are available to view (see the figure below).
The are 12 available reference layers in total:
1. Address Labels (scale dependent, visible after zoom in to scale 1: 36,112)
2. Parcels (scale dependent, visible after zoom in to scale 1: 36,112)
3. USGS Cemeteries (scale dependent, visible after zoom in to scale 1: 577,791)
4. Geographic Name (scale dependent, visible after zoom in to scale 1: 577,791)
5. Point of Interest (scale dependent, visible after zoom in to scale 1: 36,112)
6. Quad Boundary (scale dependent, visible after zoom in to scale 1: 288,895)
7. Contour Lines (scale dependent, visible after zoom in to scale 1: 36,112)
8. Hydrography
9. WV DOT Routes
10. Protected Lands
11. Floodplains (scale dependent, visible after zoom in to scale 1: 288,895)
12. FEMA Community (scale dependent, visible after zoom in to scale 1: 144,448)
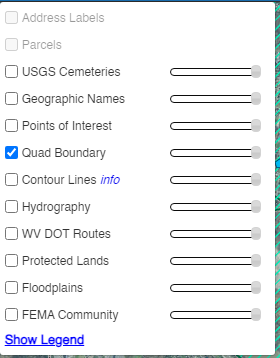
By default, only the Quad Boundary layer is turned on when the map loads (but will only be visible after zoomed into scales larger than 1:300000). In addition, there is also a reference layer for Cities / Places that is not shown in the Reference Layers list and is always visible to the viewer. Each layer can be turned on (visible) / off (invisible) by checking / unchecking on the corresponding checkbox, and there is an opacity bar for each layer as well. Some scale-dependent layers will not show up if the zoom level isn’t high enough, in such case, the checkboxes and opacity bars of these layers will be disabled until the map scale is within the visible scale range set for these layers.
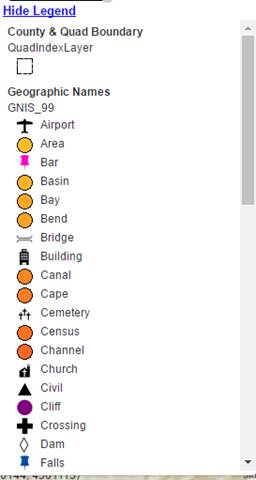
At the bottom of the Reference Layers panel, there is a button for viewing legends. By clicking the button, an expanded section will show up below it to display the legends of reference layers that are currently displayed on the map. Legends for Address Label and Public Land will not be displayed. By clicking the button again, the Legends section will collapse.
4.1.3 Basemap Layers
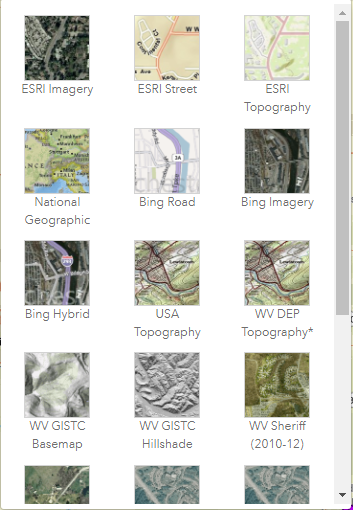
By clicking the Basemaps button, a panel will show up with the list of basemap layers that are available to view (see the figure below).
Fifteen background map layers are included in this application. The default basemap to be displayed is ESRI Street.
1. ESRI Imagery
2. ESRI Street
3. ESRI Topography
4. National Geographic
5. Bing Road
6. Bing Imagery
7. Bing Hybrid
8. USA Topography
9. WV DEP Topography
10. WV GISTC Basemap
11. WV GISTC Hillshade
12. WV Sheriff Imagery 2010-12
13. WV Best Leaves Off Imagery
14. WV NAIP Imagery 2020
15. WV NAIP Imagery 2018
16. WV NAIP Imagery 2016
17. WV NAIP Imagery 2014
18. WV NAIP Imagery 2011
19. WV SAMB Imagery 2003
20. ESRI Dark Gray Canvas
21. ESRI Light Gray Canvas
4. 2 Search / Zoom to location
The second section of the Tool Bar is Search / Zoom to location (see the figure below). This section consists of a drop-down list of options, as well as a search textbox, which can also become a drop-down list when certain options are selected.
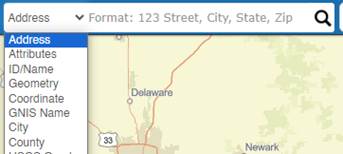
In the drop-down list, there are 8 available options in total:
1. Address Search
2. Search Features by Attributes
3. Search Features by ID or Name
4. Search Features by Geometry
5. Zoom to Coordinates
6. Search / Zoom to Geographic Name
7. Zoom to City
8. Zoom to County
9. Zoom to USGS Quad
By clicking any of these options, either an info window will show up below the tool bar, or a search box / selection drop-down list will be activated for the user to specify inputs.
4.2.1 Address Search
In the Search / Zoom to location section, Address Search is the default option.
For better address match performance, the input address is supposed to be in a complete format, containing all four segments: number, street, city and zip code, and each segment should be separated by comma.
After typing in the address and click the Search icon (or press Enter), if there is a valid search result, the map will be zoomed into the search result, and a dropped pin marker will be displayed on the result point. The Search Address panel will also show up, which contains the following 5 segments (see the figure below):
1. Locator used for geocoding
2. Disclaimer
3. Standardized address
4. Verification reminder
5. (address matched by WV SAMS Site Locator only) Longitude / Latitude
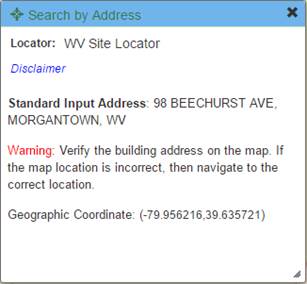
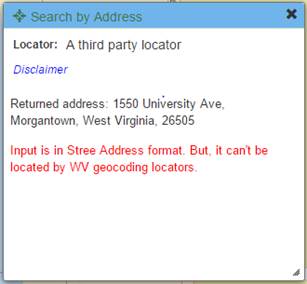
There are three locator services employed in this function:
· West Virginia Site-Based Locator Service. The base data is the actual location of every address.
· West Virginia Street-Based Locator Service. The base data, the street data, is the street data in the local resolution which will be better than the data in a national wide dataset.
· A third-party locator service.
The mechanism of selecting locator is:
1. For any user input, the WV Site-Based Locator Service will be first used to locate the address.
2. If the address can be found in WV Site-Based Locator Service, it is a precise location.
3. If the address can’t be located by the WV Site-Based Locator Service, WV Street-Based Locator Service will be used to locate the address.
4. If the locate score is higher than 80, the address will be treated as located by WV Street-Based Locator Service.
5. If the locate score is less than 80, a third-party locator service will be used to locate the address, and the locate result will be taken.
4.2.2 Search Features by Attributes
By selecting the “Attributes” option, the Search by SHPO layer attribute panel will show up, and will first ask you to choose from one type of layer. Once a layer type is selected, the attribute search options will be displayed, allowing the user to select one or multiple of them to define the search criteria (see screenshot below).
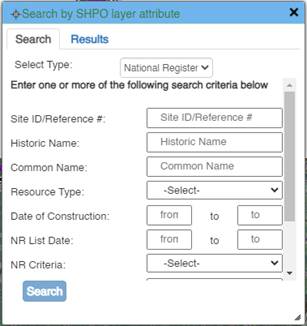
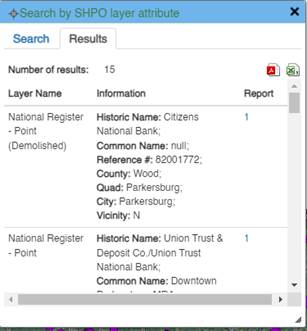
After finish defining the search criteria, the user can click the “Search” button at the bottom to open the Results tab and view matching search results. There are three columns:
· Layer Name;
· Feature Information, including the same attributes information of the feature as the identify panel, which is different for different types of layer;
· Reports. Displayed as a hyperlink to the PDF report files.
After the search input is submitted, the search results will also be displayed on the map, highlighted with yellow outlines. By clicking on each record of the search results form, the map will be zoomed into the feature and that feature will be highlighted in red, and the side information panel will also show up to display the detailed information of the feature. If there are more than one search results, two icons will show up on the top-right corner to allow the users to batch download all reports of search results, or download an auto-generated csv file for all the search results.
Please note that while the search function doesn’t require full name input and is not case sensitive, but the input value must be correctly spelled in the right order so that valid results can be returned to the user. For example, using “edgewood” as input will return “Edgewood Manor” as the result, while using “Manor Edgewood” or “Edgwood” will return no result.
4.2.3 Search Features by ID or Name
By selecting the “ID/Name” option, the Search by ID/Name panel will show up, and the search textbox will be activated to allow user input. There are 4 segments in this panel (see the figure below):
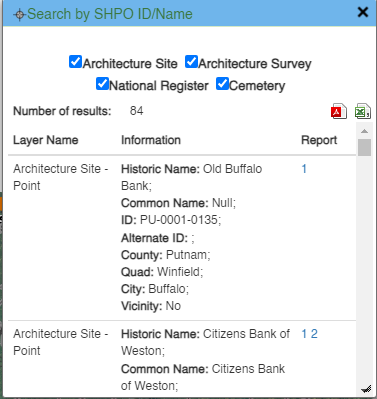
1. Layers to be searched, allowing the user to specify which layers will be included in the search;
2. Number of search results;
3. Buttons to export search results as CSV sheet / batch download PDF reports of all search results;
4. Search results form. There are three columns:
· Layer Name;
· Feature Information, including the same attributes information of the feature as the identify panel, which is different for different types of layer;
· Reports. Displayed as a hyperlink to the PDF report files.
After the search input is submitted, the search results will be displayed on the map, highlighted with yellow outlines. By clicking on each record of the search results form, the map will be zoomed into the feature and that feature will be highlighted in red, and the side information panel will also show up to display the detailed information of the feature. If there are more than one search results, two icons will show up on the top-right corner to allow the users to batch download all reports of search results, or download an auto-generated csv file for all the search results.
Please note that while the search function doesn’t require full name input and is not case sensitive, but the input value must be correctly spelled in the right order so that valid results can be returned to the user. For example, using “edgewood” as input will return “Edgewood Manor” as the result, while using “Manor Edgewood” or “Edgwood” will return no result.
4.2.4 Search Feature by Geometry
By selecting the “Geometry” option, the Search by ID/Name panel will show up, allowing the user to set search options and view results. There are 4 segments in this panel (see the figure below):
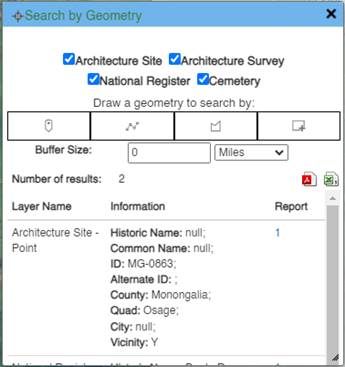
1. Layers to be searched, allowing user to specify which layers will be included in the search;
2. Type of geometries to search features. There are five options available, with an additional option to clear search graphics:
· Point
· Line
· Rectangle
· Polygon
· Last Uploaded Shapefile (only available after a shapefile was uploaded)
3. Buffer options. The buffer size can be defined in the textbox, and the unit can be specified by selecting from the dropdown list.
4. Search results form. There are three columns:
· Layer Name;
· Feature Information, including the same attributes information of the feature as the identify panel, which is different for different types of layer;
· Reports. Displayed as a hyperlink to the PDF report files.
The drawing tool will be activated when the button for any geometry type (except Shapefile) is clicked. After the user finishes drawing search geometry extent, the map will be zoomed into that extent, and all features contained within the search extent will be highlighted. By clicking on each record of the search results form, the map will be zoomed into that feature. The feature will be highlighted, and the side information panel will also show up to display its attributes information. If there are more than one search results, two icons will show up on the top-right corner to allow the users to batch download all reports of search results, or download an auto-generated csv file for all the search results.
4.2.5 Zoom to Coordinate
By selecting the “Coordinate” option, the Zoom to Coordinate panel will show up (see the figure below). In the Zoom to Coordinate panel, the coordinate can be defined in three format:
· Decimal Degrees (Latitude, Longitude)
· Degree/Minute/Second (Latitude, Longitude)
· UTM Zone 17N
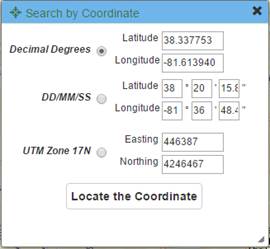
Once the coordinate is defined, the user can click the “Locate the Coordinate” button to zoom into the coordinate. A dropped pin marker will be displayed at the defined coordinate (see figure above).
4.2.6 Search / Zoom to Geographic Name
By selecting the “GNIS” option, the Search by Geographic Name panel will show up (see the figure below), and the search textbox will be activated to allow user input.
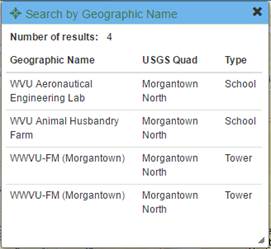
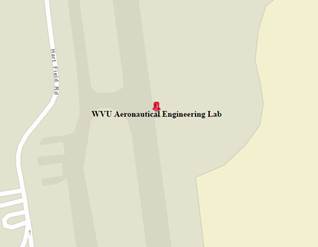
The search results will be displayed in the panel. There are two segments: The first displays the number of results, and the second is the search results table containing the following three columns: Geographic Name, USGS Quad and GNIS type. By clicking on each record of the form, the map will be zoomed into that Geographic Name point, and a graphic layer showing its text label will be added to the map viewer (see figure above).
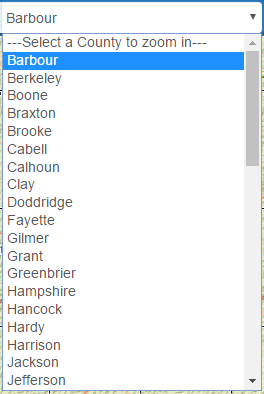
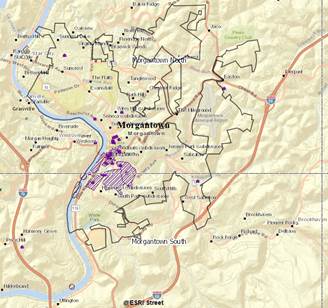
4.2.7 Zoom to City / County / USGS Quad
By clicking the “City”, “County” or “USGS Quad” option, the search textbox will become a drop-down menu, allowing the user to pick a city / county/ quad name from the dropdown list. Once an option is selected, the map will be zoomed to that specific extent, and a graphic layer showing that extent will be added to the map viewer (see figures below).
4.3 Map Tools
The third and final section of the Tool Bar is Map Tools (See the figure below). There are 7 tools available in this application:
1. Measure tool
2. Sketch tool
3. Text Markup tool
4. Bookmark tool
5. Print tool
6. Share tool
7. Add Shapefile tool
8. Clear Graphics tool
![]()
4.3.1 Measure tool
By clicking the Measure (![]() ) button, the Measure windows
will show up (see the figure below).
) button, the Measure windows
will show up (see the figure below).
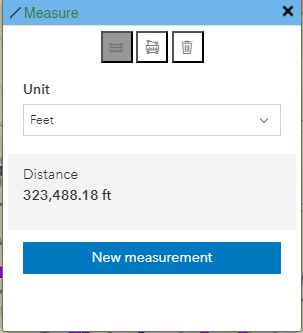
The tool window consists of two parts: The top for different measure options and the bottom for measuring results.
The user can select from two different options on the top of the window to active the measure tool, plus a Clear Measurements button to erase all graphics:
· Area (polygon): By selecting this option, the user can click on the map to draw a polygon. Once the drawing finishes (by double clicking), the area of the drawn polygon will be displayed, and the user can select a desired unit from the drop-down list of units.
· Distance (polyline): By selecting this option, the user can click on the map to draw a polyline. Once the drawing finishes (by double clicking), the total length of the drawn polyline will be displayed, and the user can select a desired unit from the drop-down list of units.
4.3.2 Sketch tool
By clicking the Sketch (![]() ) button, the Measure windows
will show up (see the figure below).
) button, the Measure windows
will show up (see the figure below).
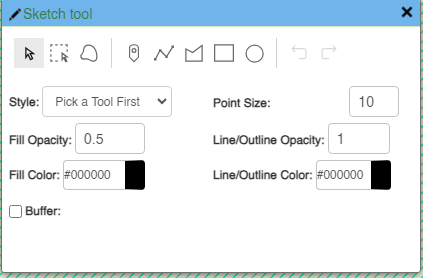
The tool window consists of three parts: The top for different drawing and selection options, the middle for customizing your drawings, with options including style, size/line width, opacity and color, and the bottom for an option to add a buffer to your drawing. The image below from ESRI provides a simple illustration on how most of the sketching option buttons on the top row works.
4.3.3 Text Markup tool
By clicking the Text Markup (![]() ) button, the
Measure window will show up (see the figure below).
) button, the
Measure window will show up (see the figure below).
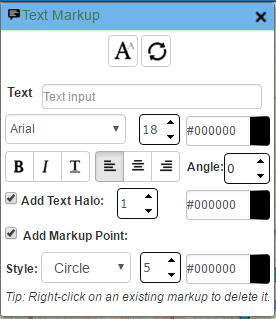
Once the window opens, the user can
click on the ![]() button to activate the tool. The user can choose
to add markup text, point or both to the map by clicking anywhere on the map
viewer. There are also plenty of customization options to set size, font,
color, halo, style to the text or markup point.
button to activate the tool. The user can choose
to add markup text, point or both to the map by clicking anywhere on the map
viewer. There are also plenty of customization options to set size, font,
color, halo, style to the text or markup point.
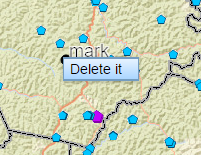
To delete a previously drawn point
or its accompanying text, simply right-click the point or text and select
“Delete it”. To delete all markups and texts, the user can click on the Refresh
(![]() ) button
on top.
) button
on top.
Please note that when the tool is
activated, the identify feature function will be deactivated to avoid
interruptions with the markup process. The identify feature function will be
re-activated by clicking on the ![]() button again, or clicking on the
button again, or clicking on the ![]() button,
or closing the tool window.
button,
or closing the tool window.
4.3.4 Bookmark tool
By clicking the Bookmark (![]() ) button, the
Bookmark window will show up (see the figure below).
) button, the
Bookmark window will show up (see the figure below).
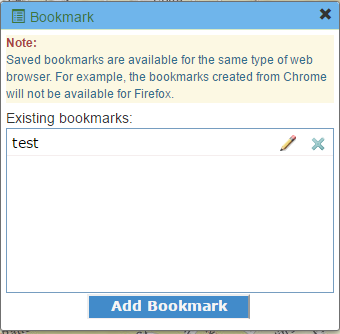
When the “Add Bookmark” button is
clicked, a new bookmark will be added to the “Existing bookmarks” section,
which stores the map extent information at the time it was created. By clicking
on an existing bookmark, the map will be reset to that stored extent. The next
newly created bookmark will be added to the bottom of the bookmark list.
Besides adding new bookmarks, the user is also able to delete a previous
bookmark (![]() )
or edit the name of an existing bookmark (
)
or edit the name of an existing bookmark (![]() ).
).
4.3.5 Print tool
By clicking the Print (![]() ) button, the
Print window will show up (see the figure below).
) button, the
Print window will show up (see the figure below).
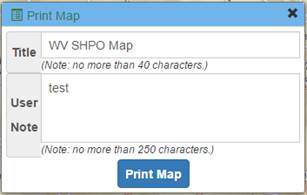
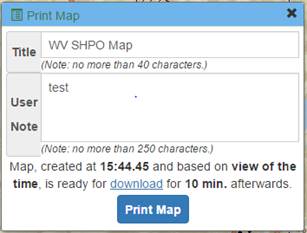
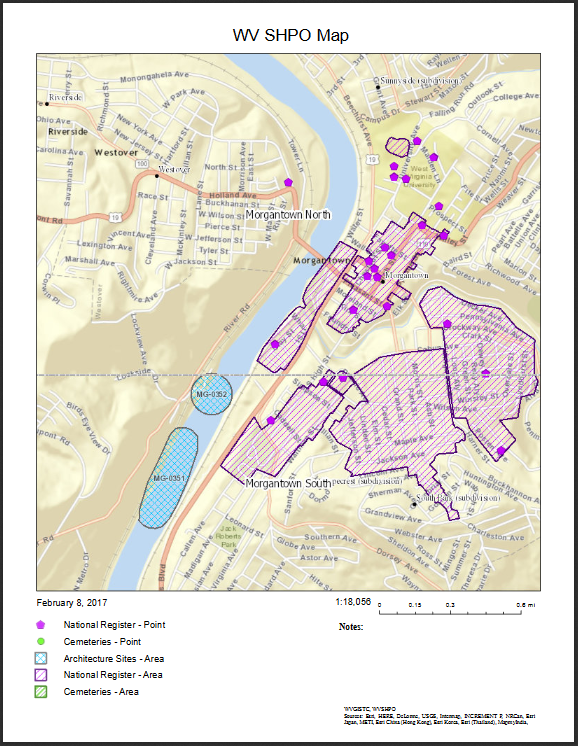
The Print tool allows the user to set map title and add user note to the output map. When the “Print Map” button is clicked, it will be disabled and the printing service will start, and the link to output map will be generated once completed. By clicking on “Print Map” again, a new output will be generated.
The output map contains all the essential map elements and useful information such as date created, legends for SHPO layers and data sources (See the figure below).
4.3.6 Share tool
By clicking the Share (![]() ) button, the
Share window will show up (see the figure below).
) button, the
Share window will show up (see the figure below).
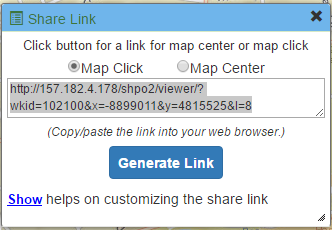
There are two options for generating a map link: using latest map click as the shared map center, or using current map center as the shared map center. After clicking the “Generate Link” button, a link will be generated in the text area, and the user can copy that link to share with others. At the bottom of the window, there is an expandable Help section that briefly explains how the link is generated.
Please note that share tool only shares the current map extent. All other information, including the layers displayed and temporary graphics, will not be included in the shared link. When the generated map link is opened, a dropped pin marker will be displayed at the map center.
4.3.7 Add Shapefile tool
By clicking the Add (![]() ) button, the Add Shapefile window will
show up (see the figure below).
) button, the Add Shapefile window will
show up (see the figure below).
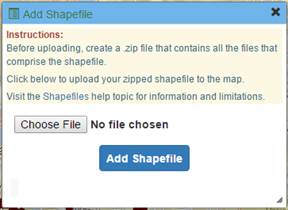
This tool allows users to upload their own shapefile data and add the data into the map viewer. The uploaded file must meet all the criteria to be displayed on the map. The related instruction information is displayed on the top of the window. On the bottom of the window, there is a progress bar that displays the progress or error messages during the upload process.
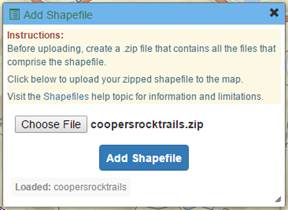
Once the uploaded shapefile is loaded, a new layer containing all its features will be added to the map with predefined symbology based on its geometry type, and the map will be zoomed to the full extent of the newly created layer. When a feature is clicked, the user can access its attribute information from a pop-up info window.
4.3.8 Clear Graphics tool
By clicking the Clear Graphics (![]() )
button, all temporary graphics that are shown on the map viewer, including
search results, highlighted features, drawings and markups, etc., will be
erased.
)
button, all temporary graphics that are shown on the map viewer, including
search results, highlighted features, drawings and markups, etc., will be
erased.
Part 5: Navigation components
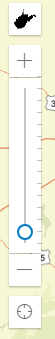
The navigation components, located on the upper-left corner of the map viewer, provides capabilities for users to easily pan around the map. they are 5 elements available for the following functions respectively:
1. Zoom to full extent
2. Zoom in
3. Zoom out
4. Zoom to current location
5. Scale scrollbar
5. 1 Zoom to full extent
By clicking the Zoom to full extent
(![]() )
button, the map area will be zoomed back to the pre-defined scale level (1:
2311162), which shows the full extent of West Virginia.
)
button, the map area will be zoomed back to the pre-defined scale level (1:
2311162), which shows the full extent of West Virginia.
5. 2 Zoom in / out
By clicking the Zoom in (+) or Zoom out (-) button, the user can draw a rectangle box on the map area by pressing and dragging the mouse. Once the mouse is released, the map will be zoomed in or out based on the extent of the box that the user draws.
5. 3 Zoom to current location
By clicking the Zoom to current
location (![]() )
button, the map will be zoomed in to the user’s current location. Please note
that when using this function, most browsers will ask for user’s permission
before executing the geolocator. In addition, some browsers, including Google
Chrome, currently doesn’t support this function.
)
button, the map will be zoomed in to the user’s current location. Please note
that when using this function, most browsers will ask for user’s permission
before executing the geolocator. In addition, some browsers, including Google
Chrome, currently doesn’t support this function.
5. 4 Scale scrollbar
With the vertical scrollbar located below the 4 navigation buttons, the user can quickly change the scale level by dragging the button on the scrollbar up (for zooming in) or down (for zooming out). The 13 predefined scale levels for SHPO Map Viewer are listed below:
· 1: 2311162
· 1: 1155581
· 1: 577790
· 1: 288895
· 1: 144447
· 1: 72223
· 1: 36111
· 1: 18055
· 1: 9027
· 1: 4513
· 1: 2256
· 1: 1128
· 1:564
Part 6: Overview Map
The figure below shows the overview map, located at the bottom-right corner of the map area. It is used to locate the current map view within a wider extent. There is a blue rectangle box within the overview map that represents the current map view extent. The user can drag and move around the box, and the main map area will change to the updated extent accordingly.
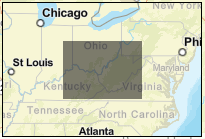
By clicking the white arrow at bottom-right corner, the overview map can be minimized. The overview map can be restored by clicking that arrow again.
By clicking the black expand arrow on top of the white arrow, the overview map will be expanded to cover the whole map area.
Part 7: Coordinate Display
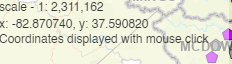
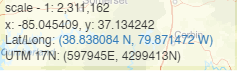
There are two parts of the coordinates display component: the first part, including current scale of the map window and the longitude/latitude coordinates, will show up and update with mouse move across the map; the second part, including the coordinates in the format of longitude/latitude as well as UTM 17N, will show up and update with mouse click on the map.